Hafez Tile Stock Affairs
History of Hafez Tile and Ceramic Company
Hafez Tile and Ceramic Factory Company (Public Joint Stock) was established in Farvardin 1975 as a limited liability company and was registered in Tehran’s Companies and Industrial Property Registration Office under number 24625 dated 07/17/1975. On 05/22/1985, it was transferred to Shiraz Companies Registration Office and registered under transfer number 37, and subsequently on 09/15/1392, it was registered in Zarqan County Registration Office under transfer number 51. On 04/14/1987, it was converted from a limited liability company to a private joint stock company and on 04/09/1373, it was converted to a public joint stock company and was accepted on Tehran Stock Exchange on 12/28/1373, and Hafez Tile shares were traded in December 1999. The factory’s main office is located in Zarqan City, Fars Province, and the Tehran office is located on Shariati Street, Ziba Street, No. 64.
About Hafez Tile and Ceramic Company
Hafez Ceramic Tile Company operates in the field of producing various types of ceramic tiles. This company, with a history of nearly 50 years, is one of the old and reputable brands in the ceramic tile industry. Relying on expert experts, a superior brand name, a complete product portfolio, the ability to produce superior quality products, and an export history, it is one of the reputable companies in this industry in Iran. Therefore, in order to maintain and improve its competitive position, the company has put on its agenda the diversification of production in different designs and dimensions and the production of glazed and nano-polished glazed tiles with new innovations due to greater market demand.
After achieving success in producing 100*100 nano-polished porcelain tiles, as the first and best manufacturer for two years, this company began producing 120*120 and 80*160 porcelain tiles with different glazes, including carving, micro-seed, sugar, etc., to add another success to its portfolio. The use of diverse facilities and appropriate infrastructure enables the company to produce various products in black, dark colors and colorful designs in any size. In addition to the domestic market, we proudly export our products to more than 20 countries around the world. The company uses the best raw materials from the best manufacturers in the world to produce the best product with the best packaging conditions.
The company from the perspective of the stock exchange
Kahafez Company in the Tile and Ceramic Group (Industry Code: 49) was registered on the Stock Exchange on 12/28/1373 with the symbol “Kahafez” and its Hafez Tile shares were traded for the first time in December 1378. Considering that Hafez Tile and Ceramic Company shares are traded on the First Market (Sub-board) of the Tehran Stock Exchange and more than 20 percent of Hafez Tile shares are in free float, the company has a 25 percent tax exemption. Other companies in the tile and ceramic industry include Saadi Ceramic Tile and Company (with the symbol Kasadi), Tekseram Tile Production (with the symbol KATARAM), Sina Ceramic Tile and Industries (with the symbol Kasavah), Behsaram Granite Production (Kahram), Pars Tile (Kapars), Seram Ara Industries (Karam), Sadaf Seram Esteghlal Abadeh Tile (Kasdaf), and Alvand Ceramic Tile and Industries (Kelvand).
The company’s stock status over the past 4 years is as follows:
| End of Fiscal Year | |||||||
| Fiscal Year Ending | Number of Shares Traded | Value of Shares Traded Million Rials | Number of Trading Days (Open) | Number of Days Traded | Market Value Million Rials | Share Price Rials | Capital Million Rials |
| 2019/03/19 | 72,862 | 3,827,121 | 215 | 215 | 21,105,500 | 14,368 | 1,468,924 |
| 2021/03/19 | 729,035 | 41,247,120 | 232 | 232 | 17,347,992 | 11,810 | 1,468,924 |
| 2022/03/20 | 898,025,426 | 4,808,573 | 165 | 165 | 18,426,183 | 3,584 | 5,141,234 |
| 2023/03/20 | 2,493,564,793 | 12,977,985 | 238 | 228 | 39,227,615 | 7,630 | 5,141,234 |
Capital increase history
According to the latest changes, the company’s capital increased from 1,468,924 million rials to 5,141,234 million rials (from receivables and cash contributions of 3,672,310 million rials) and was registered with the Companies Registration Authority on 23/01/1401.
The changes in the company’s capital since its establishment are as follows:
| Date of Capital Increase | Previous Capital (Million Rials) | New Capital (Million Rials) | Percentage of Capital Increase | Source of Capital Increase |
| 1985/08/13 | 614 | 1,414 | 130% | Cash Contribution and Shareholders’ Receivables |
| 1994/06/30 | 1,414 | 8,364 | 492% | Cash Contribution and Shareholders’ Receivables |
| 1997/12/07 | 8,364 | 15,000 | 79% | Cash Contribution and Shareholders’ Receivables |
| 2002/05/28 | 15,000 | 30,000 | 100% | Cash Contribution and Shareholders’ Receivables |
| 2003/11/12 | 30,000 | 60,000 | 100% | Cash Contribution and Shareholders’ Receivables |
| 2007/12/01 | 60,000 | 90,000 | 50% | Cash Contribution and Shareholders’ Receivables |
| 2008/11/04 | 90,000 | 120,000 | 33% | Cash Contribution and Shareholders’ Receivables |
| 2012/05/29 | 120,000 | 180,000 | 50% | Cash Contribution and Shareholders’ Receivables |
| 2020/02/01 | 180,000 | 1,468,924 | 716% | Asset Revaluation |
| 2021/08/07 | 1,468,924 | 5,141,234 | 250% | Receivables and Cash Contribution through Share Issuance |
Production by product:
The company’s products include three types of porcelain tiles, wall tiles, and floor tiles, the production capacity and production quantity of which are as follows:
| Main Products | Nominal Capacity | Actual Capacity | Unit |
| Porcelain Tiles (Various Types) | 4,000,000 | 3,840,000 | Square Meters |
| Wall Tiles (Various Types) | 1,500,000 | 1,470,000 | Square Meters |
| Floor Tiles (Various Types) | 2,000,000 | 1,920,000 | Square Meters |
| Total | 7,500,000 | 7,230,000 | Square Meters |
Considering the annual nominal capacity and the production rate of products in recent years, we find that the production of porcelain tiles, floor tiles, and wall tiles has been 104%, 86%, and 79% of the nominal capacity, respectively.
Summary of company financial information
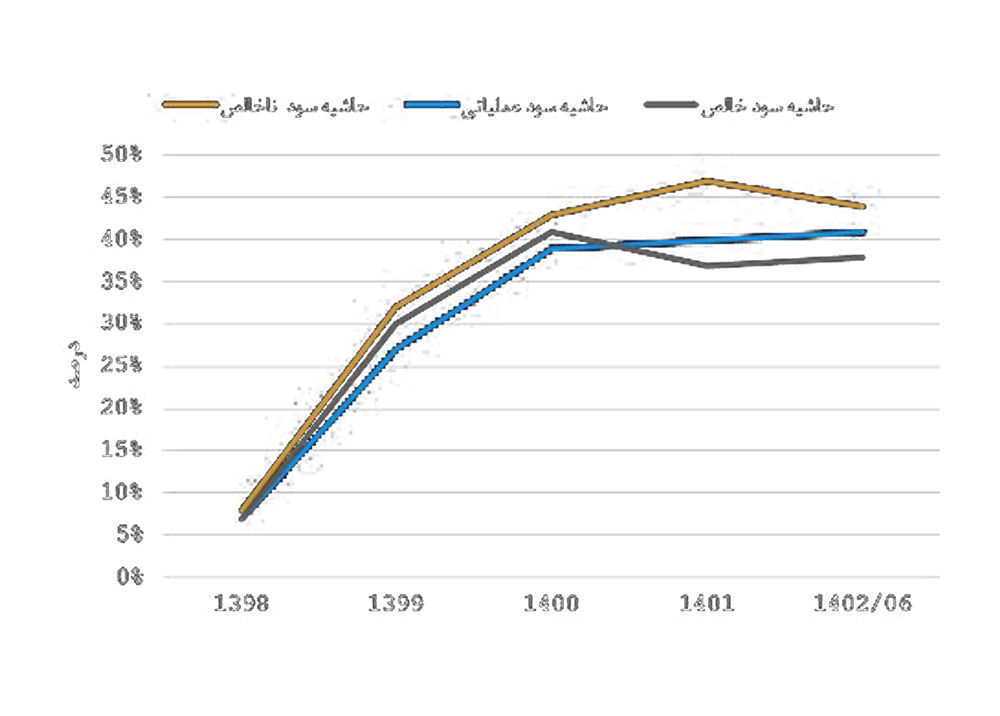
The company’s gross, operating, and net profit margins from 2019 to the first six months of 1402 are shown in the table below:
| Description | Period Ending 2019/03 | Period Ending 2021/03 | Period Ending 2022/03 | Period Ending 2023/03 | Period Ending 2023/09 |
| Gross Profit Margin | 8% | 32% | 43% | 47% | 44% |
| Operating Profit Margin | 7% | 27% | 39% | 40% | 41% |
| Net Profit Margin | 7% | 30% | 41% | 37% | 38% |
Important items of financial statements
The information on the company’s audited financial statements from 2019 to the first six months of 1402 is as follows:
Profit and loss statement
All amounts are in millions of rials.
| Description | Period Ended 2019/03 (1398/12) | Period Ended 2020/03 (1399/12) | Period Ended 2021/03 (1400/12) | Period Ended 2022/03 (1401/12) | Period Ended 2023/09 (1402/06) |
| Operating Revenues | 991,338 | 2,346,627 | 4,478,363 | 11,292,490 | 8,148,431 |
| Cost of Operating Revenues | (911,400) | (1,596,196) | (2,546,691) | (5,962,966) | (4,595,597) |
| Gross Profit (Loss) | 79,938 | 750,431 | 1,931,672 | 5,329,524 | 3,552,834 |
| Operating Profit (Loss) | 66,831 | 640,876 | 1,752,833 | 4,533,687 | 3,336,286 |
| Net Profit (Loss) | 67,766 | 703,922 | 1,648,681 | 4,226,668 | 3,072,989 |
Financial statement
All amounts are in millions of rials.
| Description | Period Ended 2019/03 (1398/12) | Period Ended 2020/03 (1399/12) | Period Ended 2021/03 (1400/12) | Period Ended 2022/03 (1401/12) | Period Ended 2023/09 (1402/06) |
| Total Non-Current Assets | 2,816,946 | 6,787,640 | 10,385,921 | 11,092,966 | 11,124,748 |
| Total Current Assets | 915,980 | 1,735,251 | 3,970,523 | 9,195,708 | 12,079,435 |
| Total Assets | 3,732,926 | 8,522,891 | 14,356,444 | 20,288,674 | 23,204,183 |
| Total Equity | 898,072 | 1,601,994 | 6,843,665 | 10,885,249 | 13,557,222 |
| Total Non-Current Liabilities | 2,303,930 | 4,425,286 | 119,490 | 3,002,214 | 2,598,658 |
| Total Current Liabilities | 530,924 | 2,495,611 | 7,393,289 | 6,401,211 | 7,048,303 |
| Total Liabilities | 2,834,854 | 6,920,897 | 7,512,779 | 9,403,425 | 9,646,961 |
| Total Equity and Liabilities | 3,732,926 | 8,522,891 | 14,356,444 | 20,288,674 | 23,204,183 |